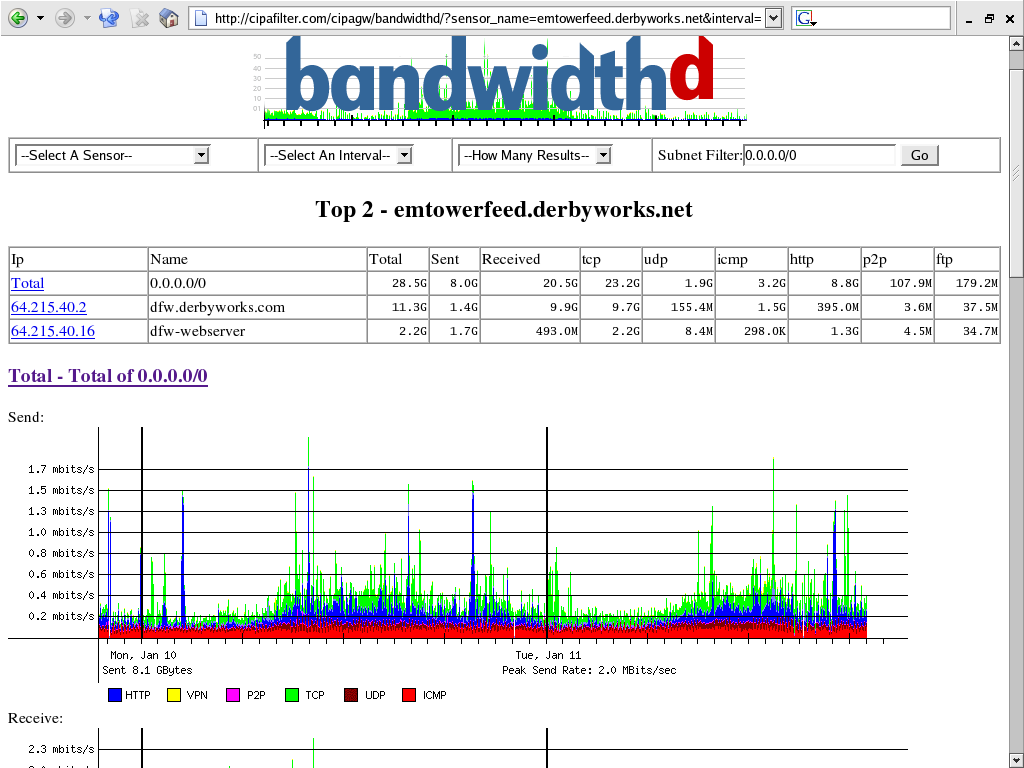
BandwidthD tracks usage of TCP/IP network subnets and builds html files with graphs to display utilization. Charts are built by individual IPs, and by default display utilization over 2 day, 8 day, 40 day, and 400 day periods. Furthermore, each ip address's utilization can be logged out at intervals of 3.3 minutes, 10 minutes, 1 hour or 12 hours in cdf format, or to a backend database server. HTTP, TCP, UDP, ICMP, VPN, and P2P traffic are color coded.

Aucun commentaire:
Enregistrer un commentaire